The next time you are riding your bicycle, watch the front wheel. It may wobble very slightly. If it does wobble very slightly, think of the wobble as occurring on either side of a planar axis. The wobbling wheel goes from one side of the planar axis, across the zero line and ends up at the other side of the axis. This pattern then repeats.
So it is with the Sun and indeed all the planets. Thee planets orbit the Sun in the ecliptic plane, but they exhibit some wobble. Astronomers and scientists call this “declination”.
As for the Sun, to an observer on Earth, the Sun over time can be seen at higher and lower positions above the horizon. This results in shorter and longer days and warmer and cooler temperatures. This is why we experience longer days in Summer and shorter days in Winter.
But, here is the burning question. Does the declination of the Sun affect our emotions and thereby the markets?
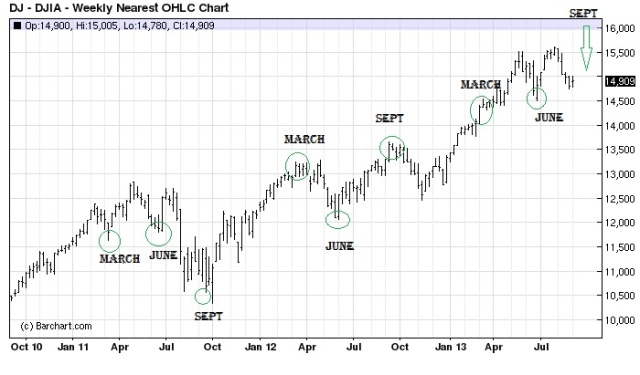
The embedded chart herein shows the price action of the Dow Jones (weekly nearest) from late 2010 to present. Notice the circled dates and note how these dates align to pivot swings. Note too that these circled areas on the chart occur variously at March, June and September times.
What is so special about these times?
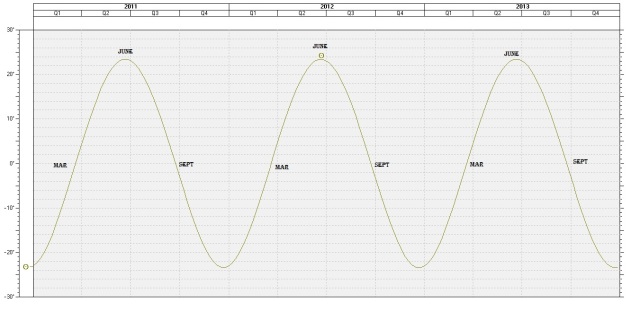
The other embedded chart herein is the Sun’s declination during 2011-2013. Notice how in March the Sun’s declination goes from being negative to crossing the zero line and turning positive. In June, the Sun reaches its maximum declination. In September, the Sun goes from being at positive declination to crossing the zero line into negative territory.
Evidently there is a metaphysical link between Sun’s declination and our emotions. This is all then reflected in the market price action. How exactly this all works remains a mystery. Instead of dwelling on the metaphysics of it all, I prefer to use these March, June and September timeframes as a tool to assist me with trading. We are now drawing near to that time in September when we can expect an inflection point on the Dow Jones (and other indices too). Traders should be alert for this inflection point. Technical chart indicators will tell you when an inflection point is at hand.
For a more visual look at declination, take a peek at my recent YouTube video at the following link: http://youtu.be/zd6dawlaJD0

