ASX 200 and Uranus Harmonics

Harmonic lines as calculated using the Oreste methodology can be used to get a better handle on the ASX200 Index in Australia.

In the calculations, I have set CS=2.

I find that the Uranus harmonics are particularly powerful at having aligned to past swing highs and lows. Hence, if following the ASX200, I advise continuing to watch the Uranus harmonics (and sub-harmonics).

The following chart ( not the greatest…) was extracted from a website that I found. I have overlaid the various Uranus harmonics and sub-harmonics on it. Notice, if you will, how well these lines have caught past swing pivot points.

The next target for the ASX 200 is the 5788 level which is a full harmonic. Recent comments from the team at Helix Trader in Australia point to a developing rising wedge pattern. These comments should be taken seriously as rising wedges can turn ugly in a hurry. A likely turning point for this wedge pattern is the 5788 Uranus harmonic.

ASX200 and Uranus harmonics


Soybeans and the Mercury Influence

In a recent edition of my Astrology E-Alert, I penned a quick note for subscribers on the topic of Soybeans to illustrate the connection between Beans and Mercury Retrograde events.

The daily nearest chart embedded in this post has been overlaid with red boxes to denote the Mercury Retrograde events. I have further added the 18 and 55 day moving averages as well as a Jupiter harmonic line.

Note that in late January 2014 and into February, price action was below these moving averages. As Mercury turned Retrograde, price action moved up through these averages and a nice rally followed. As Mercury turned retrograde again last week, price action slipped under these moving averages and Soybeans now can be seen to be less than attractive from a chart technical point of view. We have about 12 days remaining in the Mercury retrograde event. Watch for some interesting price action to occur in alignment with the remainder of this Retrograde event.


GSCI

Toronto Stock Exchange TSX Index with Jupiter Harmonics

The idea of a harmonic is a deep esoteric one and a more complete explanation is best found in Quantum Trading by Fabio Oreste. A simple way of thinking about harmonics is aptly described by the definition penned in the 1940s by physicists Wheeler and Feynman who posited that the Universe consists of a standing wave which develops harmonically related standing waves and each of these does the same.

In my research, I recently came across Oreste’s book in the British Library in London that explained how to calculate and generate harmonic lines in the context of price charts. In the following weekly chart of the TSX Index, you will note that I have overlaid some blue lines. These are some of ( but not all of..) the Jupiter 1st harmonic lines. Note how these lines bound the price highs and lows in 20212 and the most recent lows in late October 2013.

The question now as the TSX pushes up to its old highs is – where will it go?

The Jupiter harmonics are suggesting that between now and end of March, immediate support rests at 13781 and immediate overhead resistance is at 14141.


GSCI

Declination of Jupiter and Mars

My recent research at the British Library has opened my eyes to the power of Jupiter and its declination path. Jupiter has a declination path that takes it from a declination low to a subsequent low in approximately 12 years. Along the way, the declination path exhibits minor vibrations. The following image illustrates Jupiter’s declination from 1904 to 1933. Notice how declination minima, maxima and zero levels generally align to Dow Jones Average peaks, bottoms and in one case an acceleration of trend. Looking at this plot and in particular the 1929 timeframe, I would hazard a guess that W.D. Gann in his day was well aware of declination and likely used it in his market prognostications. The one caveat with Jupiter is that its declination inflections do take time to evolve given the slow moving nature of the planet itself. Knowing that a Jupiter declination event is coming, one will then have to be alert for a couple months or so on either side of the exact event.  Along the way, one will also have to watch for declination events of the faster inner planets as well as other planetary aspect events in order to more closely identify the market turning point.

GSCI

to read the remainder of this article, please visit www.investingsuccess.ca. Once there, click on the PUBLICATIONS tab and then look for the drop down menu item called ARCHIVES.

Wheat Futures – The Classic McWhirter Approach for Commodity Brokers New to Astrology

The McWhirter astrology technique as outlined in her 1938 book calls for an examination of locations of Sun and Moon in the first trade chart. The ruler of the Sun’s sign is also to be noted as is the location of Jupiter.

In the case of Chicago Wheat which started trading on 2 January, 1877 we see that Sun is at 12 Capricorn and Moon is at 22 Leo. The “ruler” of Capricorn is Saturn.

Fast forward to the present and we can see how the McWhirter technique could have helped a Commodity Broker and his/her client to navigate the volatile Wheat market. A study of astrological aspects for the past several months shows that Sun made a 0 degree aspect to Neptune in the third week of February, a 0 degree aspect to Uranus in late March, and a 0 degree aspect to Jupiter in third week of June. Sun is now approaching Saturn for a 0 degree aspect. In mid-July, Venus transited past the natal Moon position at 22 Leo. In mid August, Sun moved past this 22 Leo position. In late September, Mars moved past this Leo position.

Just recently, Venus moved past the natal Jupiter location just as Sun started to begin its journey towards next week’s aspect to Saturn.

On the following chart, I have attempted to illustrate these events. Note the price moves that ensued as these events unfolded.

There are many ways to navigate the choppy commodity markets. Some brokers focus entirely on fundamentals while others focus on the chart technicals. In my days as a Commodity Advisor, I watched the technicals. Astrology provides yet another tool to use in combination with technicals and fundamentals. Knowing that an astrological aspect date is approaching, you can watch technicals for a change of trend and thereby protect your client. You can also watch for price to react differently to fundamental news as human emotion changes.

GSCI

Silver-Esoteric Math and Astrology

The following is a text version of a recent video I posted to You Tube at : http://youtu.be/J2WSl2QL58A

Square root math can give a new perspective to Silver prices by starting at the May 2011 price peak that saw Silver futures hit nearly $50/oz. Iterations of square root math calculations produce many possible support levels including $18.13. Notice how in late June 2013 Silver hit a low of $18.21 which confirms the validity of the square root calculations. From $18.21 a Gann 2×1 line can be projected forwards in time. Observe how this line acted as support for some weakness in Silver prices in August 2013. Late August saw an intra-day high on the Dec ’13 futures of $25.16 which aligns perfectly to what square root math had predicted. I rather suspect that we will see Silver prices in September come down to test the Gann 2×1 line. Square root math suggests to watch for possible support levels of $21.30, $20.39 or even $19.50. To overlay some astrology onto this silver story, a starting point is to look at the natal chart (first trade chart) of Silver futures from 1933. By adjusting the chart so that Sun is on the cusp of the first House ( this is how W.D. Gann and Louise McWhirter would have done it) we can see that Moon and Saturn make hard aspects to Sun. In fact, the pattern created by Sun-Moon-Saturn is called a YOD by traditional astrologers. Moon at 14 degrees Sagittarius, Saturn at 15 Aquarius and Sun at 12 Cancer then become key points to be alert to. Gann and McWhirter would have watched for faster moving planets Mercury, Venus and Mars to transit past these key points. Transit dates would have been watched for possible price inflection points. The chart embedded herein that shows astrological events makes it clear that indeed transits past these key points do in fact align to inflection points on Silver price. Lastly, although it may not be immediately obvious from the natal chart, Silver futures started trading 2 days before a Full Moon. Notice on the price chart that contains the square root math how Full Moon and New Moon events tend to align to swing points in Silver price. This Silver case study is a good example of how esoteric math, lunar events and planetary transits past key natal points all work hand-in-hand to give you deeper insight into price swings. Such is the power of the cosmos.

GSCI

GSCI

GSCI

Gold – Esoteric Math & Astrology

This is the text version of a recent video I posted on YouTube at: http://youtu.be/wM1JHs76W6Y

In October 2012, the December ’13 Gold futures contract hit an intra-day high of just over $1800/oz. Closing price was $1777.

Using $1777 as a starting point, numerous square root iterations can be calculated as per the Square of Nine.

One possible support level that emerges from the calculations is $1218. In fact, in late June 2013 this Dec ’13 Gold contract had a close of $1213/oz.

Next, using $1213 as a start point, square root math shows that $1412 is a possible resistance level. In late August we can see that this contract found resistance at $1413 and turned lower from there.

Using $1413 as a start point, square root math now suggests $1302 and $1284 are possible levels of support.

 Astrology adds another layer to this story. The embedded price chart herein shows a series of purple arrows and some yellow boxes. The purple arrows are Sun-Pluto hard aspects. Note how these aspects align reasonable well to swing points in Gold price. The yellow boxes are those times when Mercury is retrograde. Note that during these events, Gold price tends to exhibit a small, counter-trend rally.

If you are a Gold trader, or even of you trade Gold mining stocks and are looking for Gold to regain its positive “mojo”, take note that late September-first week of October will deliver a Sun-Pluto hard aspect. Pluto will be at 9 degrees of Capricorn and Sun will transit through the early stages of Libra for a 90 degree hard aspect.

Also note that Mercury will go retrograde again on October 21st.

Knowing that these events are pending, you can use your technical chart analysis and begin watching for the chart technicals to create a buy signal. The Sun-Pluto hard aspect may then provide you with some solid confirmation of any buy signal that develops…

 GSCI
GSCI


Sun Declination and the Dow Jones

The next time you are riding your bicycle, watch the front wheel. It may wobble very slightly. If it does wobble very slightly, think of the wobble as occurring on either side of a planar axis. The wobbling wheel goes from one side of the planar axis, across the zero line and ends up at the other side of the axis. This pattern then repeats.

So it is with the Sun and indeed all the planets. Thee planets orbit the Sun in the ecliptic plane, but they exhibit some wobble. Astronomers and scientists call this “declination”.

As for the Sun, to an observer on Earth, the Sun over time can be seen at higher and lower positions above the horizon. This results in shorter and longer days and warmer and cooler temperatures. This is why we experience longer days in Summer and shorter days in Winter.

But, here is the burning question. Does the declination of the Sun affect our emotions and thereby the markets?

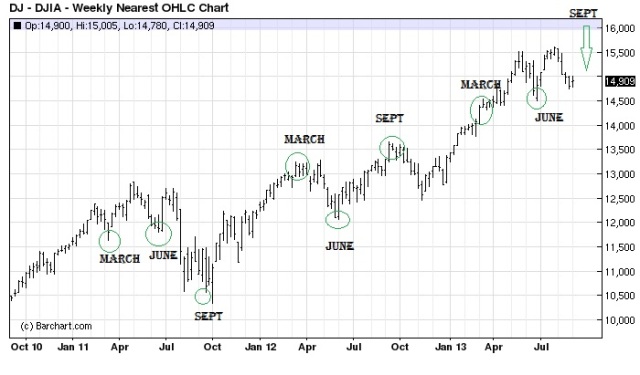
The embedded chart herein shows the price action of the Dow Jones (weekly nearest) from late 2010 to present. Notice the circled dates and note how these dates align to pivot swings. Note too that these circled areas on the chart occur variously at March, June and September times.

What is so special about these times?

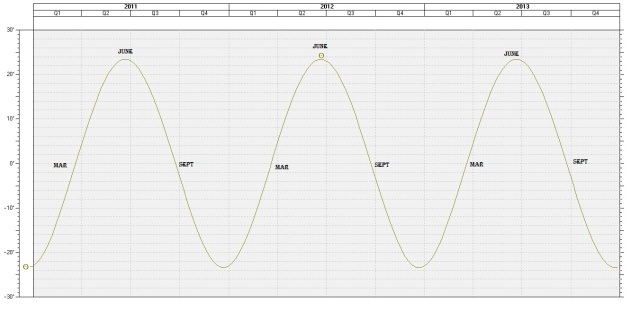
The other embedded chart herein is the Sun’s declination during 2011-2013. Notice how in March the Sun’s declination goes from being negative to crossing the zero line and turning positive. In June, the Sun reaches its maximum declination. In September, the Sun goes from being at positive declination to crossing the zero line into negative territory.

Evidently there is a metaphysical link between Sun’s declination and our emotions. This is all then reflected in the market price action. How exactly this all works remains a mystery. Instead of dwelling on the metaphysics of it all, I prefer to use these March, June and September timeframes as a tool to assist me with trading. We are now drawing near to that time in September when we can expect an inflection point on the Dow Jones (and other indices too). Traders should be alert for this inflection point. Technical chart indicators will tell you when an inflection point is at hand.

GSCI

GSCI

For a more visual look at declination, take a peek at my recent YouTube video at the following link: http://youtu.be/zd6dawlaJD0

Moon-Mars Conjunction and the Dow Jones

In a recent edition of my Astrology E-Alert, I suggested to subscribers that they pay attention to the timeframe around Sept 1-2, 2013. This was the Labor Day holiday, but the electronic markets were operational. I expressed concern about this timeframe because Moon was set to transit past Mars. Mars is a key planet for the New York Stock Exchange as a result of the 10th natal house configuration.

The embedded image herein presents a 60 minute chart showing price action of the Dow e-mini futures (Sept’13 contract). Notice the volatility. On the Sept 1 overnight session, the futures gapped up. Monday being the holiday, prices held constant. But, on Tuesday, futures were slammed down again. This is a brilliant example of human emotion being affected by astrology. Also on this image, I have a blue circled area. This is the New Moon event of Sept 5. Again, notice the wild volatility as emotions were triggered. To the passive investor this all is insignificant. But, to a short term trader, emotional triggers can be profitable times indeed.

GSCI

Post #100 – Euro FX , Gann Lines and Saturn Lines

The embedded chart in this ( 100th post !!) shows the December 2013 Euro futures contract. From the significant high of 1.3678 on Feb 1, 2013 I have constructed the Gann lines using the technique discussed in The Lost Science. I have further constructed Gann lines from several significant swing points on the chart to really confuse your eyeballs. Then to top it off, I have overlaid some Saturn transit lines on the chart.

At this time, the Euro futures have support at a Saturn line at about 1.3250. Trend is following a 1×3 Gann line that extends from the May low. Failure to get above this 1×3 line, will see the Euro pull back to test the Saturn support line. If this happens, the 1×2 Gann line extending from the July lows will come into play.

GSCI